PROVIDING AN INSTANT GLANCE AT ROI STATUS & TRENDS
SUMMARY
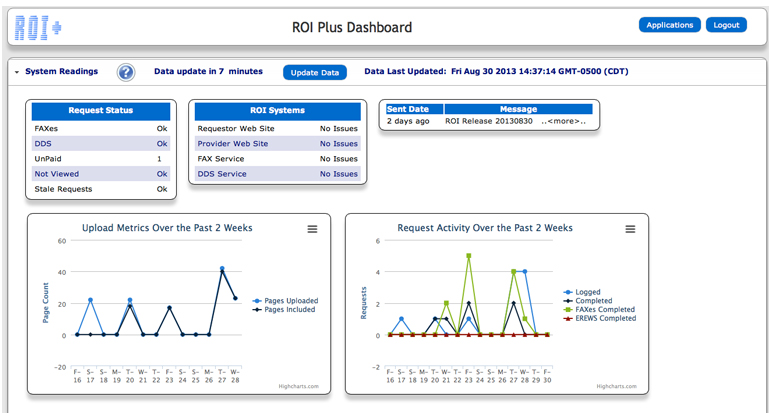
Because compliance and productivity determine who will survive in the healthcare industry, ABT Medical, Inc. has released a strategic addition to its ROI+ solution: the ROI+ Digital Dashboard. With the Digital Dashboard, Providers can instantly visualize and respond to current PHI request activity. The dashboard’s design makes accessing up-to-date data simple and fast. Using an intuitive graphical display that is thoughtfully laid out and easy to navigate, the dashboard summarizes and arranges up-to-date metrics and key performance indicators on a single screen. HIM managers can now track ROI fulfillment logging, PHI aggregation, fulfillment completion, Requestor notifications, and PHI viewing activity. They can see the high-level processes at a glance and then drill down into low-level data. Because this detail is typically buried deep within the standard reporting process, it has never before been so readily available to Provider executives. To determine just how efficient their ROI fulfillment staff is, Providers can also capture productivity data for each phase of the workflow process, thus obtaining a “snapshot” of staff performance. The dashboard reports visually on system performance and announces ROI+ release and maintenance notifications in real time.
Benefits of the ROI+ Digital Dashboard:
- Obtain real-time visuals of key performance measures
- Identify and correct negative trends
- Evaluate and modify new trends
- Measure efficiencies/ inefficiencies in current fulfillment process
- Make better-informed decisions based on performance intelligence
- Align strategies and organizational ROI fulfillment goals
- Save time compared to running and analyzing multiple reports
- Gain instant and total visibility of system performance
- Quickly identify data outliers and correlations
- Conduct easy
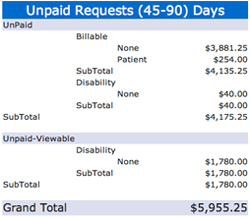
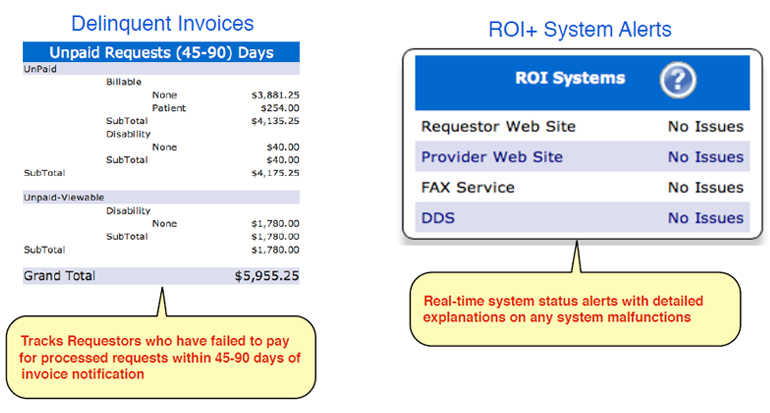
INVOICE MANAGEMENT
Managing Requestor behavior on payment activity is a major challenge. Requestors who fail to pay within the critical 45-90 days are tracked here.
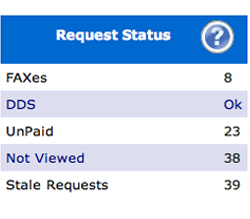
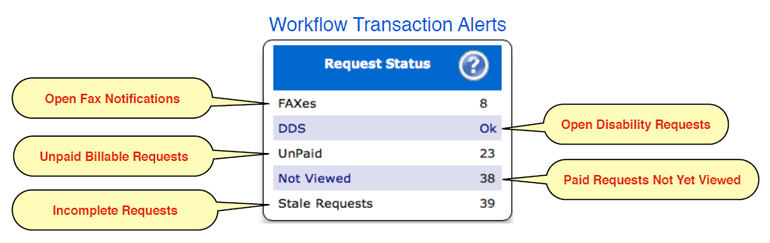
ACTIVITY STATUS
Shows specific status indicators for requests in the active transaction processing cycle. Clicking on the status value provides detail on the relevant transactions.
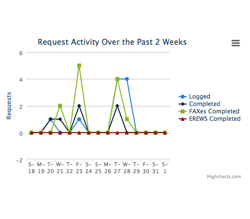
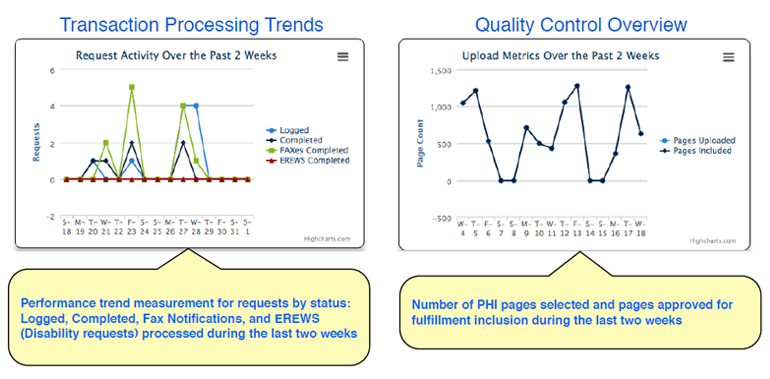
TREND ANALYSIS
Performance trend measurement for requests by status that have been processed during the last two weeks are displayed here chronologically.